Infographic Templates That Build Themselves
- 1. Import your text using our bulk import feature
- 2. Select a template
- 3. Pick icons and the design style that you like
tap on each infographic template
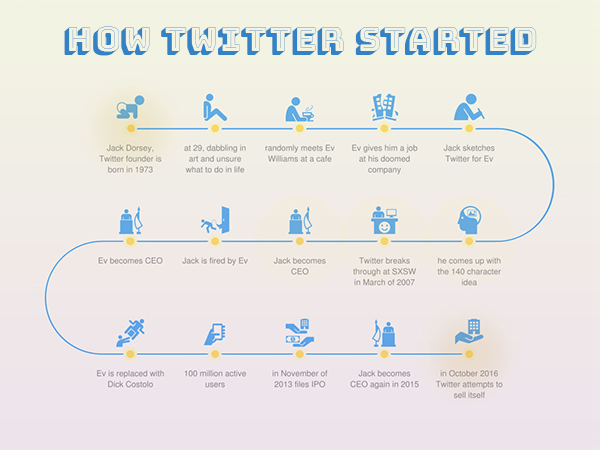
Timeline Infographic
Timelines are great for visualizing sequential events. This winding timeline template in particular works well for sharing on social media. You can iclude 15-25 points without sacrafising readability.
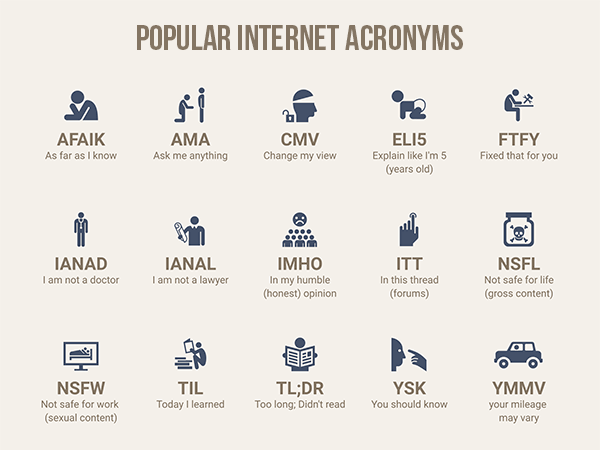
Grid Infographic
The grid infographic template is the most compact template using space with maximum efficiency. Grids work for information where every point has the same characteristics as other.
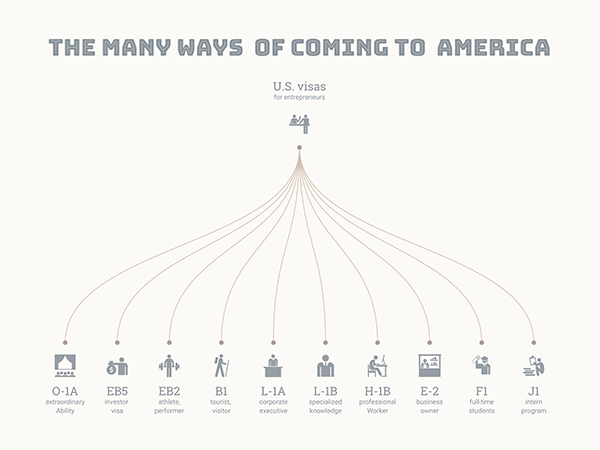
Tree Infographic
Trees are good for showing hierarchies, trees up to 10 points are readable on social media
Spiral Infographic
Spirals are the most compact way to represent time and sequences of events. They have two different directions: clockwise and counter clockwise.
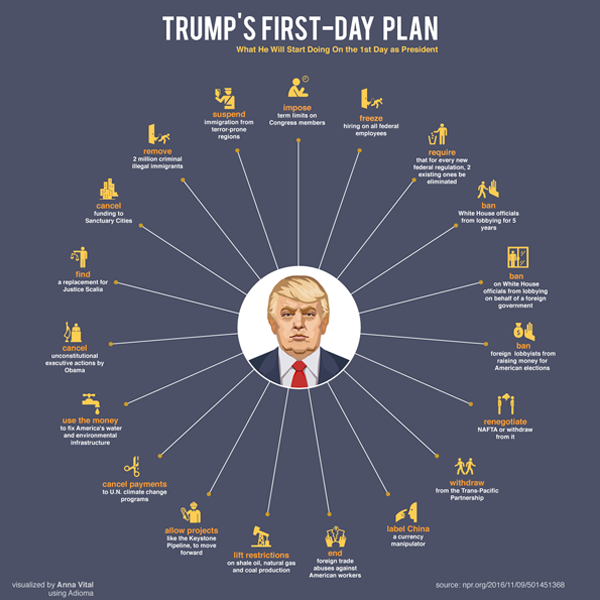
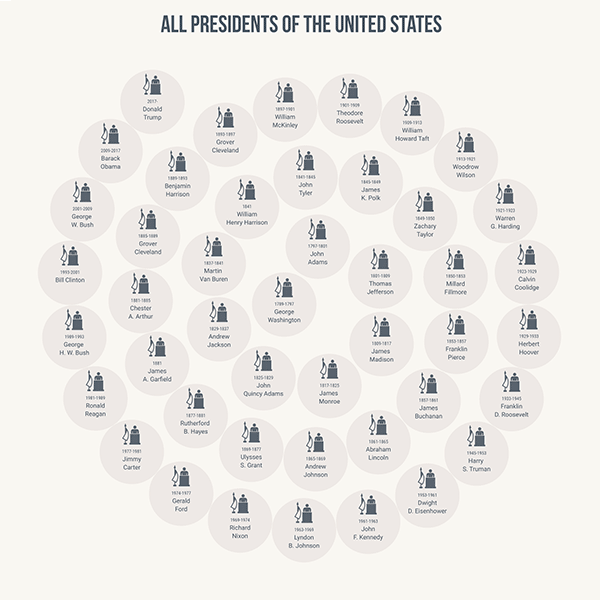
Spokewheel
Spokewheel is another way to look at a tree, if you flattened one. The avantage of a spokewheel is that most people will read it clockwise.
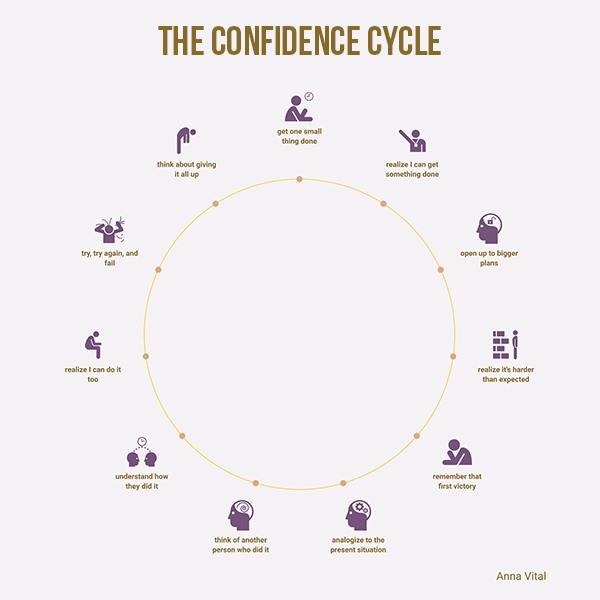
Cycle Infographic
Cycles are for showing events that repeat in a certain sequence, for example product release cycles, seasonal events, daily routines.
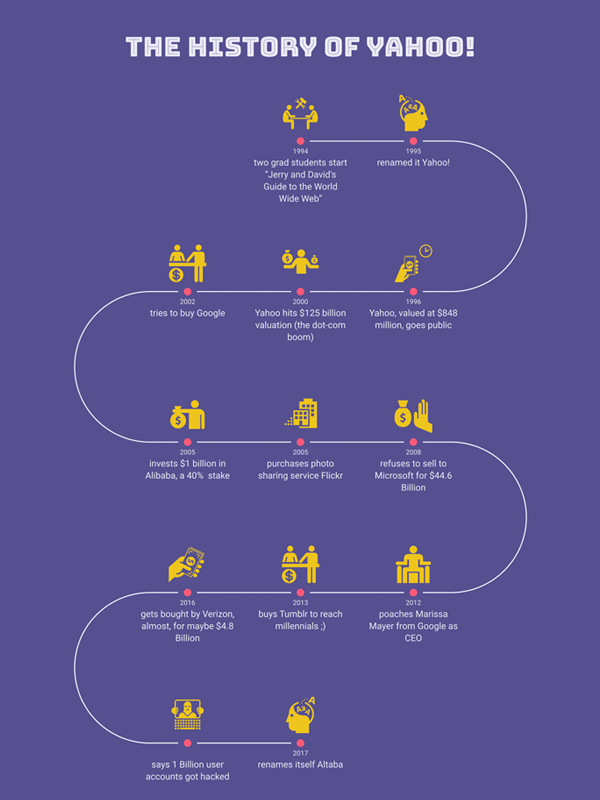
Winding Timeline
Histories, steps in a process, projection of the future, biographies are all good candidates for a timeline. This is another instance of a timeline that is mobile and web friendly.
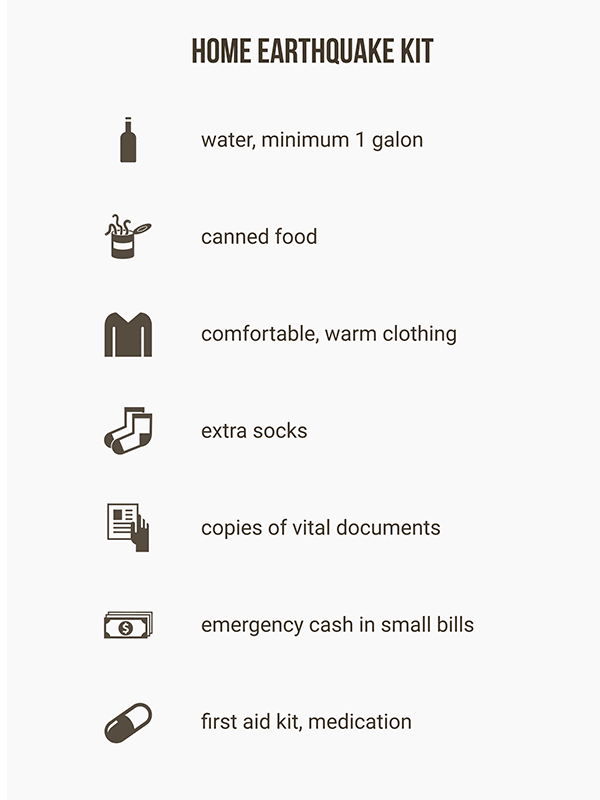
List Infographic
This is a list illustrated whith icons, that makes it easy to find the items.
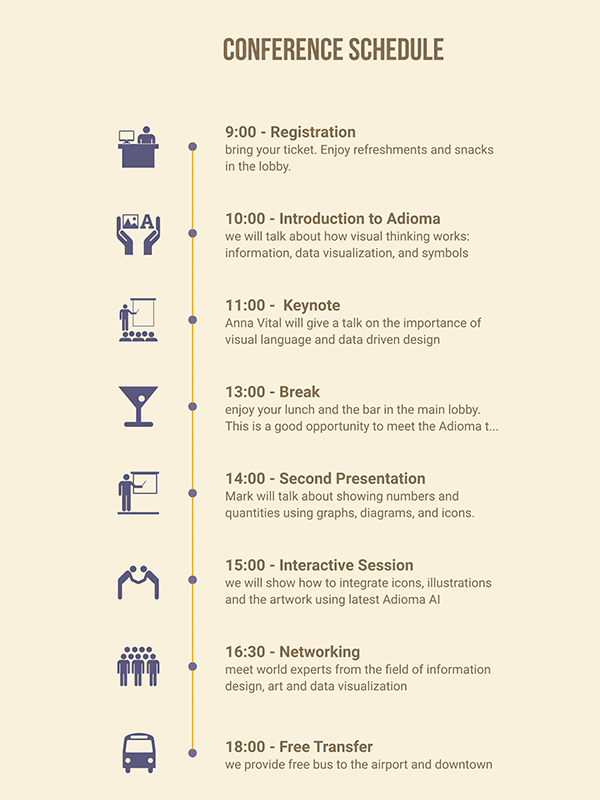
Vertical Timeline
These timelines are great for visualizing schedules, resumes and procedures